This article provides an in-depth look at the Prospect Engagement Profile (PEP). The PEP is a unique set of data analytics that translates webinar engagement into valuable intelligence that is automatically delivered to sales, right at their fingertips. It is designed for integration into CRM systems.
The Prospect Engagement Profile provides all of a prospect's business interests listed in one place to determine intent, along with the recent webinars they have attended, the questions asked, polls answered, resources downloaded, etc., so Sales can initiate a meaningful and relevant conversation.
Note: The Prospect Engagement Profile is available with ON24 Connect or Advanced Analytics. Reach out to your Account Manager for more information.
There are two ways to open the Prospect Engagement Profile (PEP):
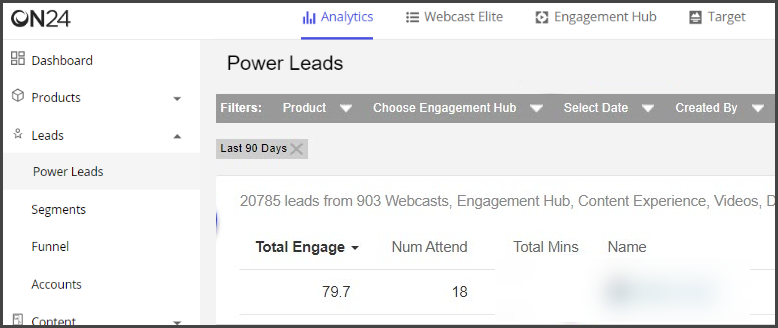
- Click the Analytics link at the top of the page
- Select the Power Leads report
- Once the report loads, click on the attendee's name to launch the PEP
|
 |
|
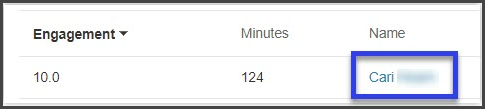
The PEP may also be launched from the Audience Report in Webcast Intelligence by clicking on the attendee's name.
|
 |
In a single view, you can access a report card of the prospect's recent interactions with your ON24 account. The PEP is organized so the important information is front and center, without having to search for it.
Security
Accessing the Prospect Engagement Profile (PEP) URL requires that users/viewers be logged into the ON24 platform to protect attendees' Personally Identifiable Information (PII). PII includes the following:
- Name
- Email Address
- Phone Number
- Company
We have determined through our ongoing review of best practices that PII should not be displayed on the PEP pages when accessed outside of ON24 (through and integration for example) and have implemented additional security. In most cases, this is irrelevant as you are launching the PEP from a user record in a system that is integrated with ON24, and you will already know who the user is.
If you are using the PEP through integration the PEP will be visible but with no PII.
Allowlisting
Anyone clicking on a PEP link from a domain that is not on the PEP referrer allowlist will be denied access to the Profile page (unless logged into the Elite account.)
The PEP referrer allowlist will contain:
- ON24.com: All PEP links clicked from any ON24 report will continue to work for anyone.
- Salesforce.com: If you are using the Salesforce integration and embedding your leads' profile pages in your Salesforce instance, this will continue to work as it always has.
In addition to those two domains, any other domain (or subdomain) can be added to your PEP referrer allowlist. You may want to add your own company's domain so that you can post links to lead profiles from pages on your own site. Or you may want to add the domain for any third-party software that you integrate with, where you might be clicking on PEP links.
To add domains to your PEP referrer allowlist, please submit a technical support request .
Prospect Engagement Profile
|
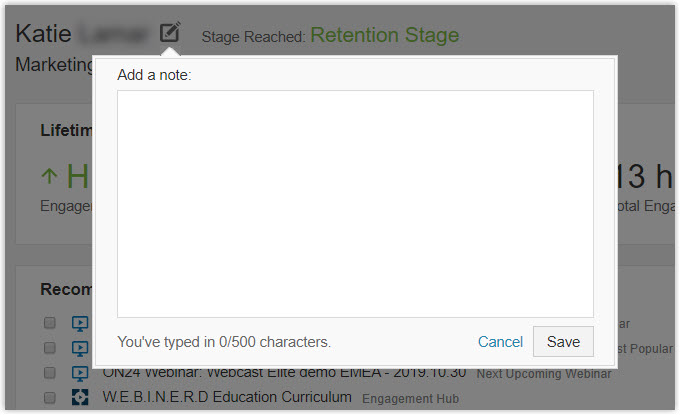
Note Taking
- Take short notes to track engagement with every potential lead
- Notes are limited to 500 characters
|
|
|
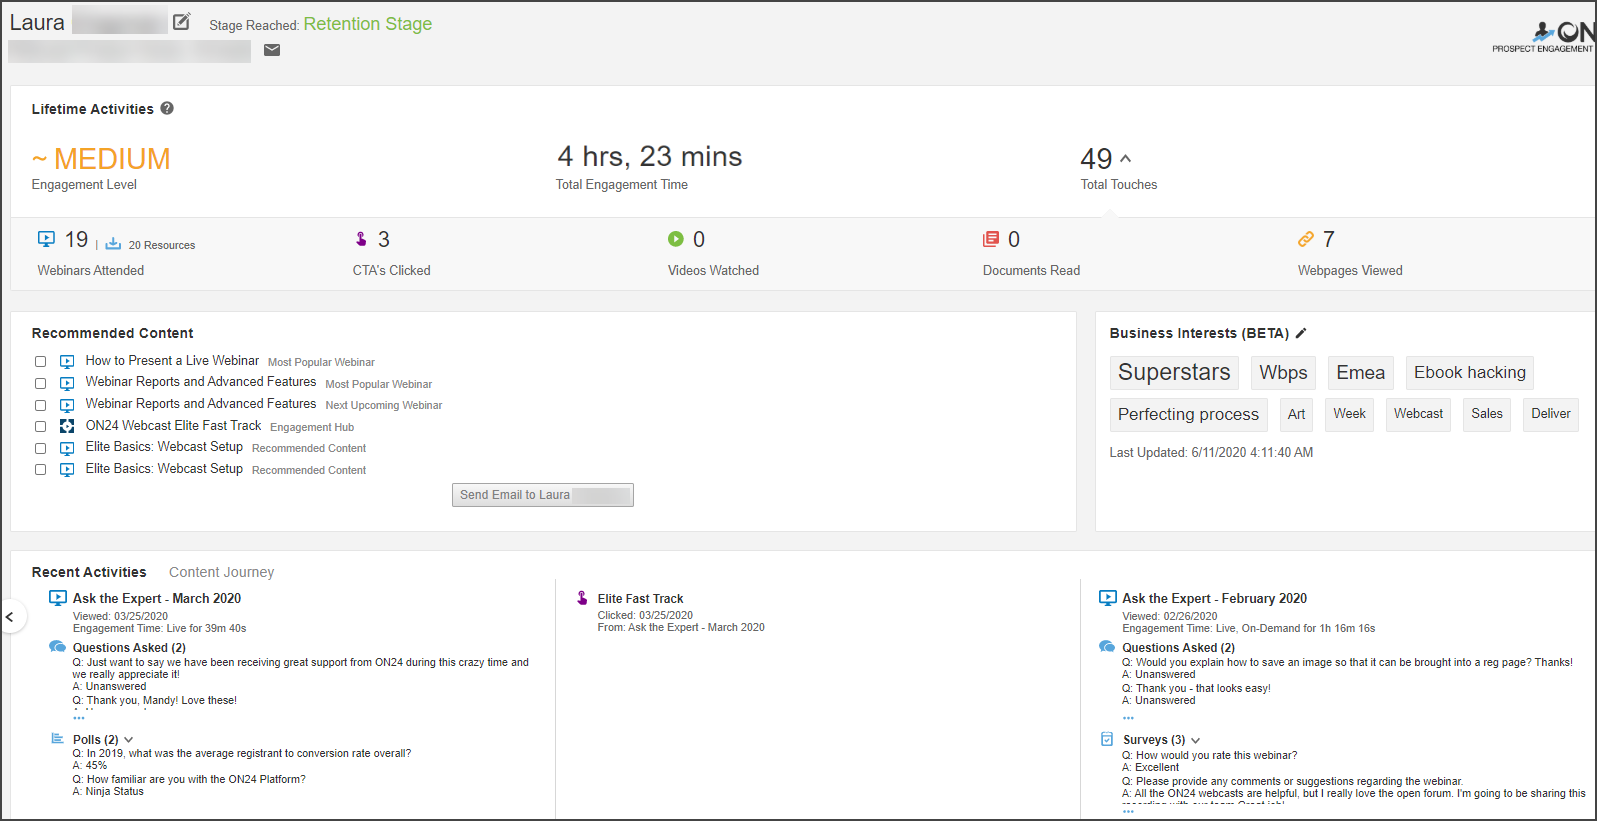
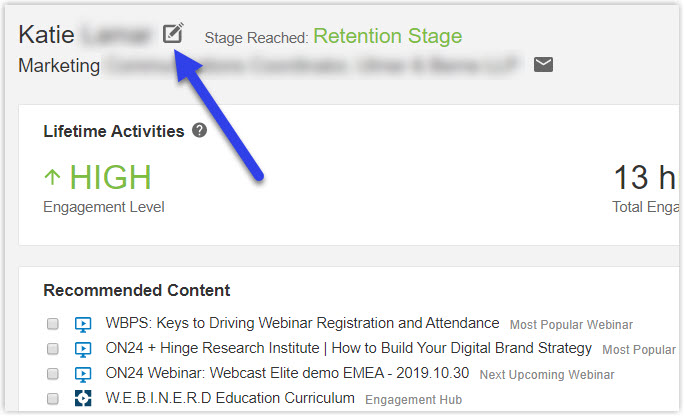
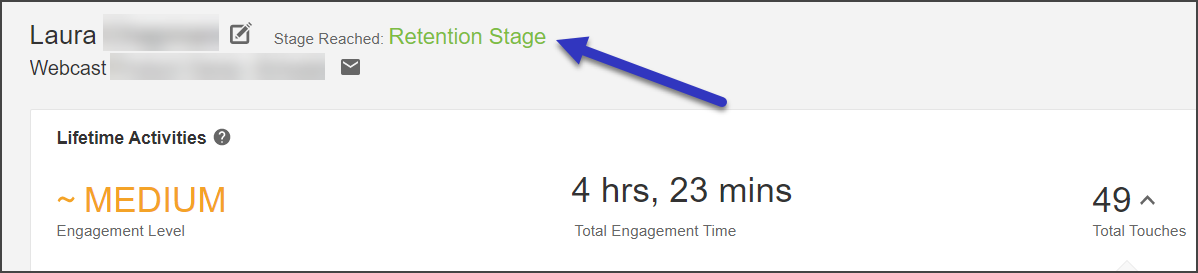
Retention Stage
- The funnel stage reached will be represented at the top
|
 |
|
Lifetime Activities
- A summary of all the engagements the prospect has in your account
- Click on the arrow next to Total Touches to get additional details
- See below for a breakdown of the information provided
|
 |
|
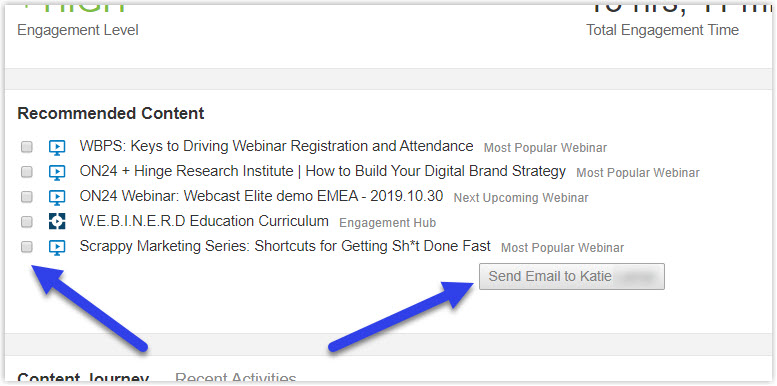
Recommended Content
- Helps your sales team provide prospects with additional resources to help with their content journey
- Using Artificial Intelligence, ON24 will generate a content list based on the prospect's previous activities including:
- The webinars they've attended
- The resources downloaded from the Resource List within the webinars
- Text from questions they submitted while attending the webinar
- The content will be ordered by the likelihood of interest
- Check one or more of the boxes to email the linked content list to the prospect
- Clicking the Send Email button will automatically launch a new email and a custom message may be added before emailing the prospect
|
 |
|
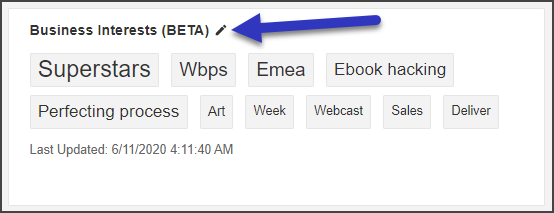
Business Interests
- Provides keywords related to the specific interests of the prospect to assist Sales with follow-up conversations
- The keywords are generated using Artificial Intelligence and are based on the following text elements:
- The titles of the webinars the prospect attended
- The titles of resources the prospect downloaded from the Resource List within the webinars
- Text from questions they submitted while attending the webinar
- You can opt-in to share this information with other ON24 webcast customers (as long as they have also done so), in order to build out a more robust profile
- No information other than that seen in the Business Interest Cloud is shared - no demographic data or detailed activity data
- Click the Edit icon to remove keywords that do not provide value to create a more refined assessment over time
- Deleted words will be removed from the report within 24 hours
|
 |
|
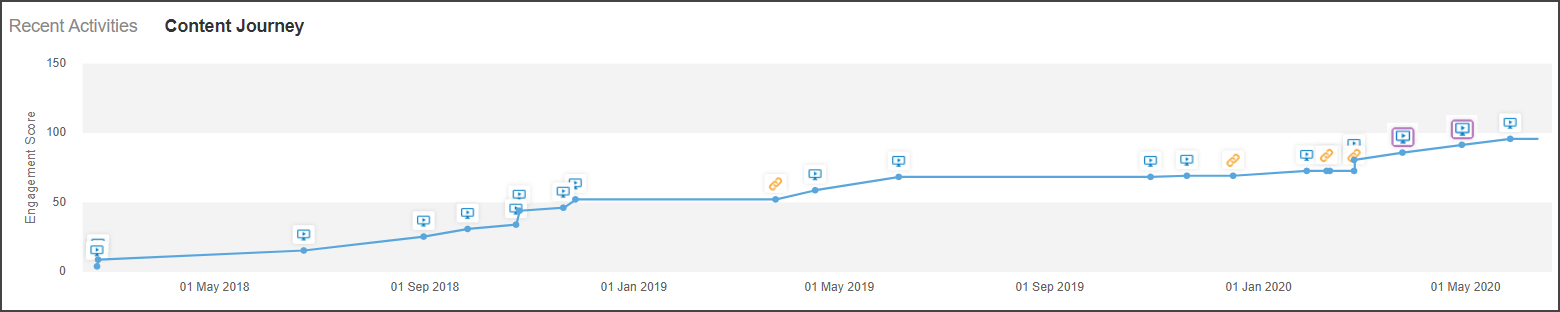
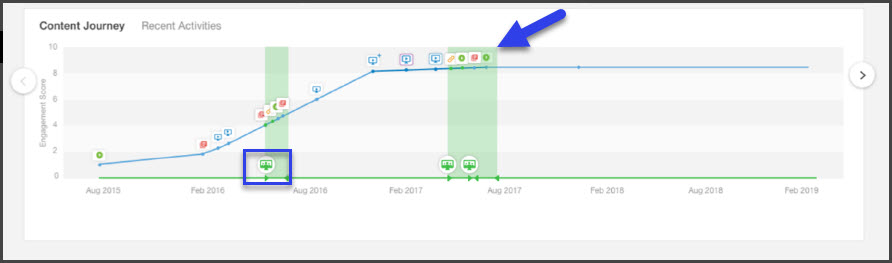
Content Journey
- A visual view of all the content a prospect has engaged with, including when they watched and how engaged they were.
- The sharper the angle of the line, the more engaged the lead was.
- The line represents the growing engagement of the lead, while the points on the line represent each event, with icons showing the content type.
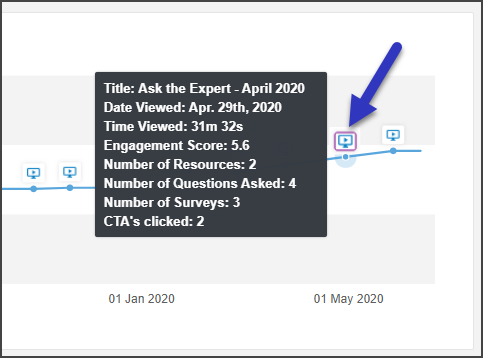
- Hover over any event on the line to get details such as content title, date viewed, and Engagement Score.
- Call to Actions (CTAs) will display a purple border around the webinar icon on the content journey line (as shown). Any webinar that shows with a purple border around it represents one where the lead clicked on at least one CTA.
- Rolling over the icon will open a popup with interaction Edit details for the webinar.
- Nurture Page Report
|
|
|
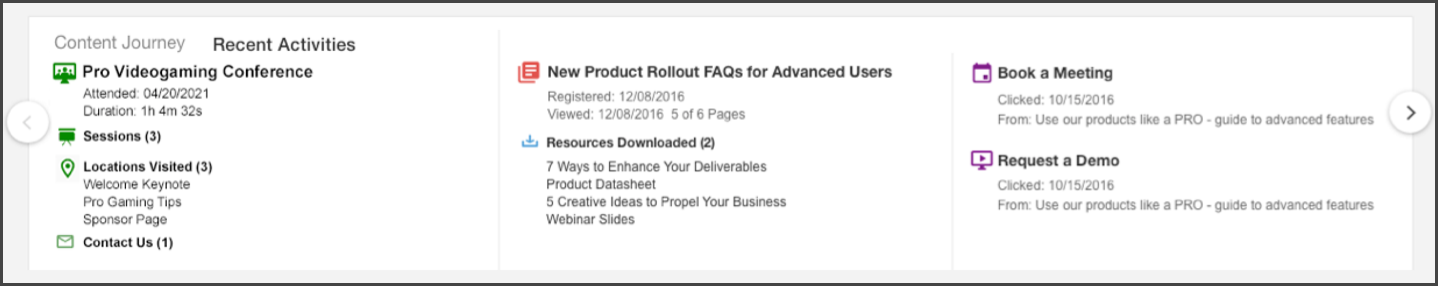
Recent Activity
- The six most recent activities completed by the prospect including webinars attended, questions asked, resources downloaded, CTAs clicked, Buying Signals, and responses to any given polls and surveys will be displayed. Virtual Conference Engagement (if applicable to your account) will also be displayed in Recent Activity. Any conferences that your lead has attended recently, as well as details on any Buying Signals from leads within virtual conferences.
- If the lead clicks on any conversion tools in any of the most recent six pieces of content they viewed, there will be a separate column in the Recent Activities section showing the Buying Signals clicked. If the lead clicked on multiple conversion tools from within the same webcast or Target page, all of those clicks will appear in one column.
- Use the < arrows > to scroll through the most recent activities.
- If using the ON24 Engagement Hub, new content views, including URLs, videos, and documents within the Engagement Hub will also be tracked.
-
Nurture Page page data will be available
|
 |
|
Virtual Conference Engagement
Note: This is only applicable to accounts that have run Virtual Conferences
When the lead has attended a virtual conference recently, there will be a column in the Recent Activities area for that conference. The details provided for each conference include:
- Conference Name
- Conference Date Attended – if the lead attended on multiple days, this will show the most recent date that the lead attended this conference
- Duration – the total time spent by the lead in the conference and any content included in the conference
- Sessions – the number of sessions within this conference attended by the lead
- Locations Visited – the list of locations within this conference that the lead visited
If this lead clicked on any conversion tools (Book Meeting, Request Demo, etc.) from within the virtual conference, the details for those clicks will also be listed, in a separate column, in the Recent Activities section.
For each conversion from the lead, the details will show:
- Conversion Tool Name
- Date Clicked
- From – The name of the Virtual Conference that included the conversion tool
|
|
Lifetime Activities Features 
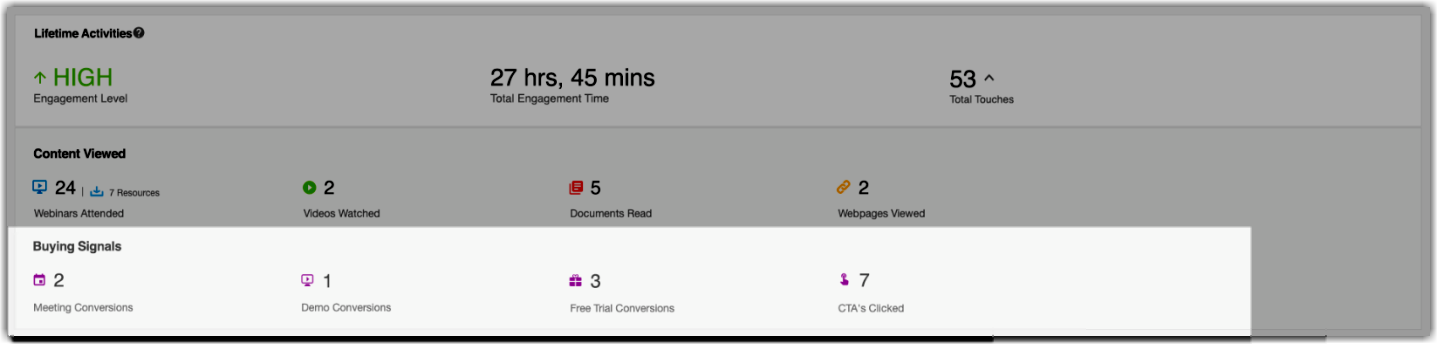
The Lifetime Activities of the prospect are displayed among several different sections. Below is a breakdown of how these metrics are captured.
|
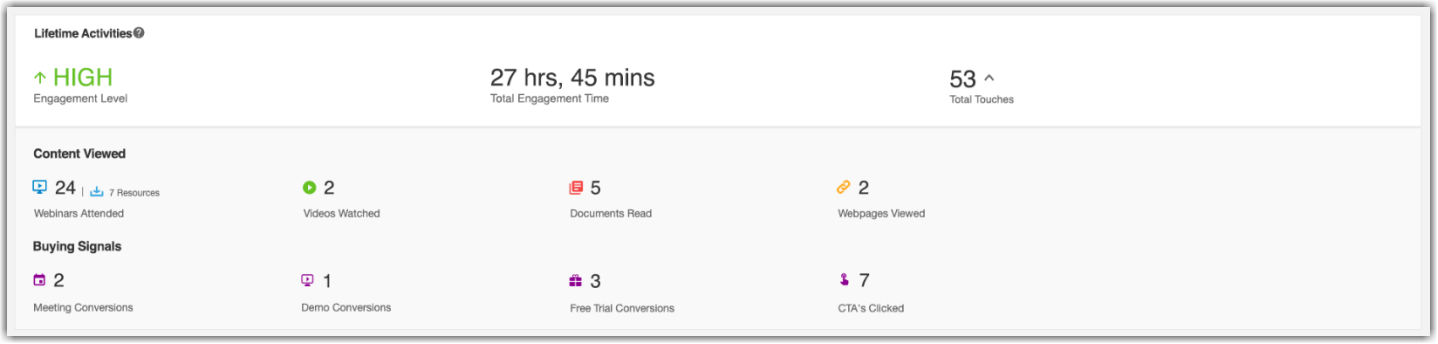
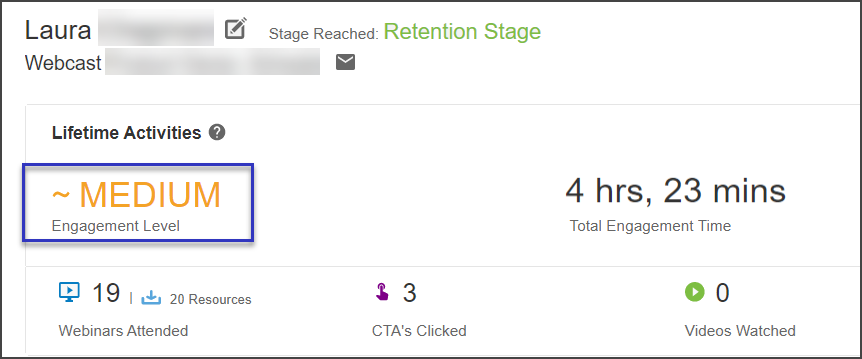
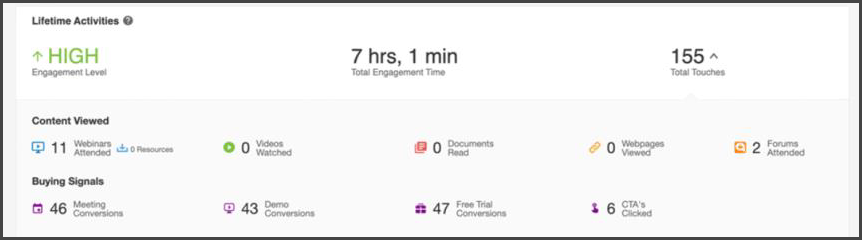
Engagement Level
The engagement level can be either HIGH, MEDIUM, or LOW and is calculated primarily on the total time spent within the ON24 account in the recent past.
- High: Watched 55+ minutes in the last 30 days
- Medium: Watching 55+ minutes in the last 60 days
- Low: Everyone else
|
 |
|
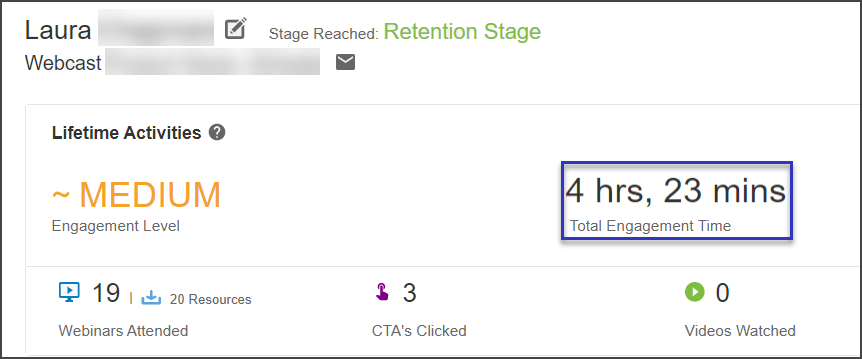
Total Engagement Time
Displays the total time the prospect has engaged with webinars and all other associated content made available via the Engagement Hub.
Note: Also includes any time spent by the lead attending virtual conferences (if applicable to your account).
|
|
|
Total Touches
Displays the total number of times, the prospect interacted with or "touched" the ON24 platform. This number is based on the number of webcasts or Forums attended, resources downloaded, Call to Actions clicked, as well as videos, documents, or web pages made available within the Engagement Hub.
Click the arrow to display additional metrics.
|
 |
|
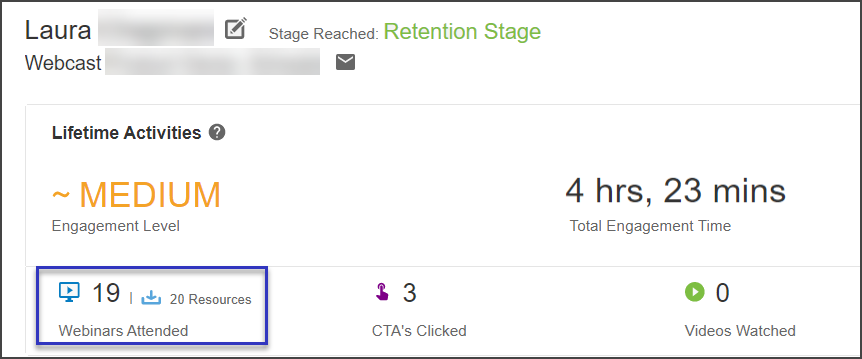
Webinars Attended & Resources
Displays the number of webinars attended and the number of resources downloaded by the prospect from the Resource List during the webinars
|
 |
|
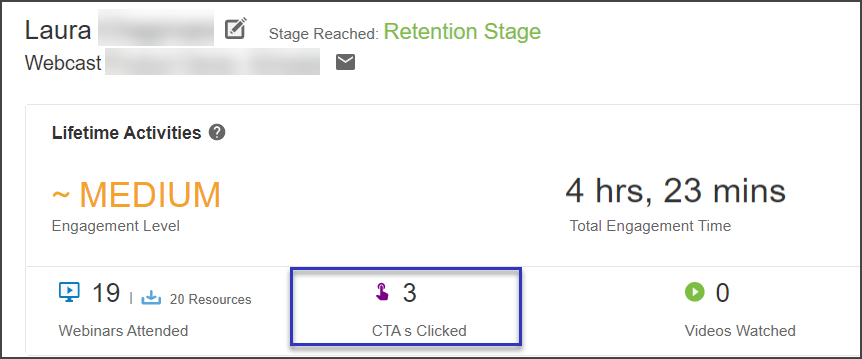
CTAs Clicked
Displays the number of Take Action tools the lead has clicked on from the webinars attended.
Details about which CTAs were clicked and from where can be found in both the Recent Activities section and the Content Journey chart at the bottom of the page.
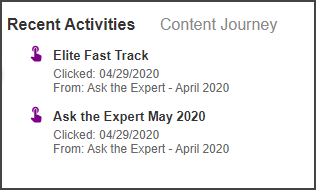
In the Recent Activities section, CTA clicks will be in their own column, denoted by the purple CTA icon. The column will show all CTAs clicked from one webinar, including:
- The name of the CTA
- The date the CTA was clicked
- The name of the webinar from which the prospect clicked on the CTA
If anyone clicks on more than one CTA from the same webinar, those CTAs will each be listed individually in the same column (as shown)
|
|
|
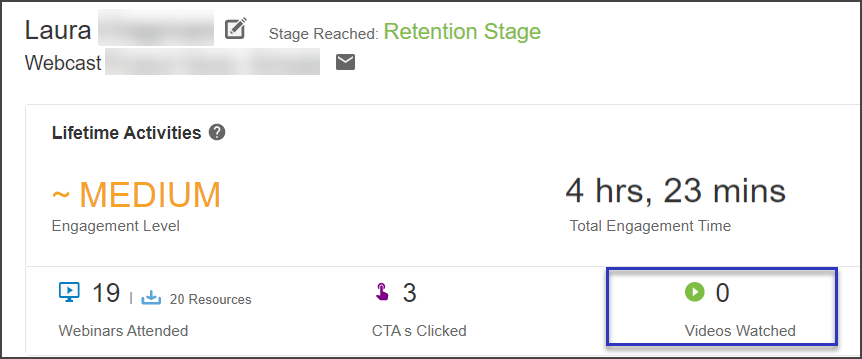
Videos Watched
Indicates the number of videos watched
Available if using the Engagement Hub
|
 |
|
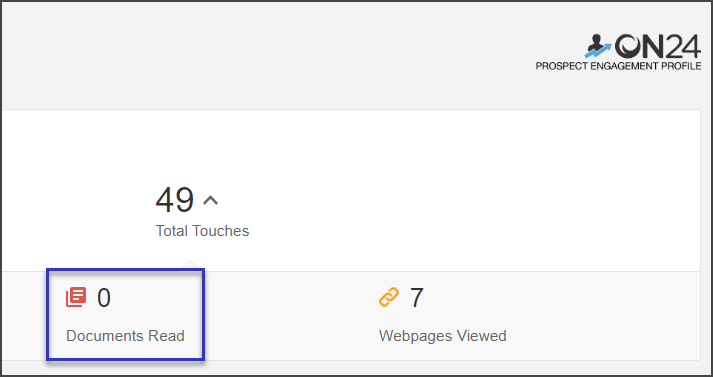
Documents Read
Indicates the number of documents viewed
Available if using the Engagement Hub
|
 |
|
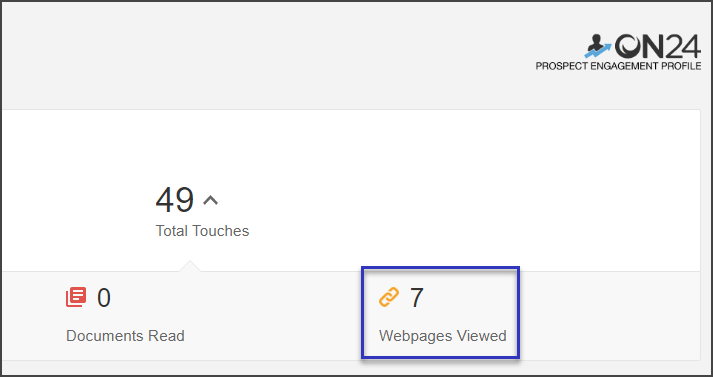
Webpages Viewed
Indicates the number of external URLs viewed
Available if using the Engagement Hub
|
 |
|
Buy Signals
The numbers show the number of times this lead has clicked on each of the conversion tools (as well as Calendly and any CTAs in your content) over the lifetime of the lead. These numbers include clicks on conversion tools from both webcasts and Target pages.
|
 |
|
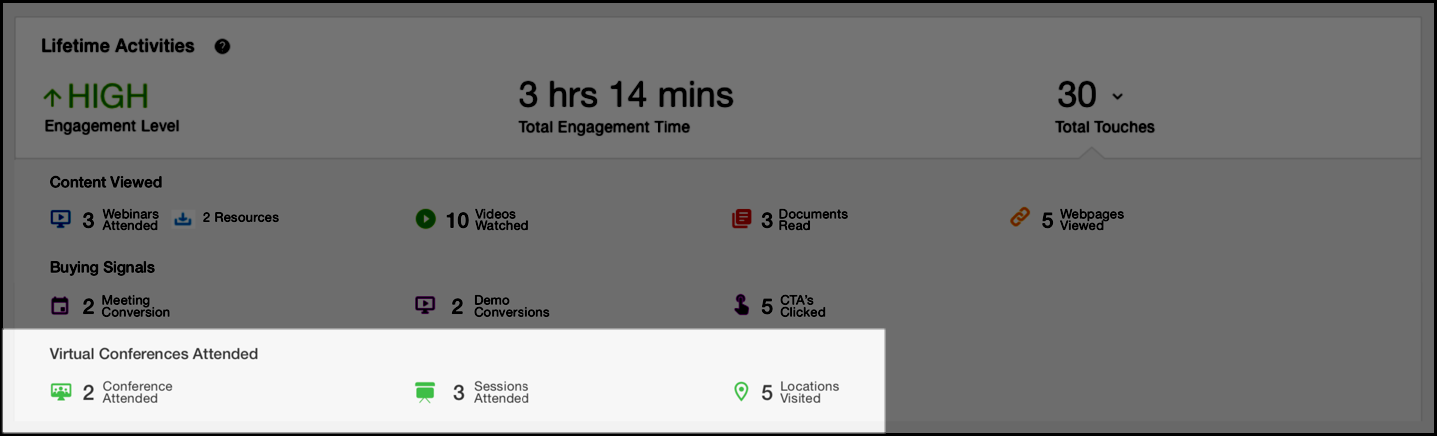
Virtual Conferences
If your lead has attended any Virtual Conferences, there will be an additional row with details for the lead’s engagement within virtual conferences, including the number of sessions attended and locations visited.
All Virtual Conference data in the Content Journey chart is included on the Prospect Engagement Profile.
Note: The Prospect Engagement Profile is available to all users with the Advanced Reporting and Analytics package in their account.
The green line at the bottom of the chart shows which conferences this lead has attended and the dates of attendance. The conference icon is displayed on the first date of each conference attended. Rolling over the conference at the bottom of the chart will open a popup with details of all events and interactions the lead had during that conference.
A vertical green background displays across both the conference timeline and the blue event timeline above. Using the green background, you can tell which events this lead attended within a Virtual Conference.
Note: Events attended from within conferences will be marked with a green dot on the event timeline, instead of a blue dot.
|
|
Comments
0 comments
Please sign in to leave a comment.